
Where China Invests: What Its Global Investment Map Reveals
A look at which countries received the most Chinese investment from 2005 to 2025 and what that says about Beijing’s priorities.
When people talk about Chinese investment, many still instinctively picture Africa, Southeast Asia, or countries linked to the Belt and Road project. But if you look at the numbers from the last two decades, the picture becomes much more interesting. China has invested not only across the developing world, but also in the largest Western economies. That becomes especially clear in an infographic showing China’s outward foreign direct investment from 2005 to 2025.
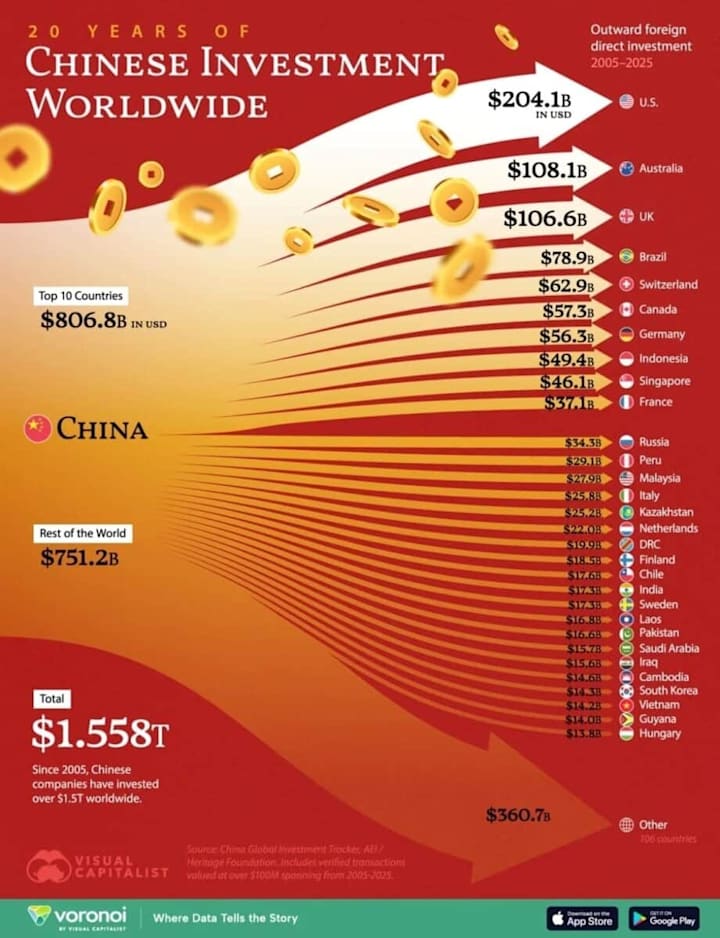
According to those figures, the total volume of Chinese investment over that period reached $1.558 trillion. Of that, $806.8 billion went to just ten countries, while another $751.2 billion was spread across the rest of the world. That means nearly half of all Chinese investment was concentrated in a limited number of key destinations. And the composition of that top ten says more about China’s strategy than anything else.
The Main Recipient Is the United States
In first place stands the United States, with $204.1 billion. That is the strongest and, at first glance, the most surprising figure. Against the backdrop of constant talk about trade wars, technological rivalry, and political confrontation, the United States still turns out to be the single largest destination for Chinese investment.
In reality, there is no contradiction here. For a long time, China invested where the biggest markets, technologies, brands, and access to the global financial system could be found. The American economy offered exactly that. Even amid political tension, capital often moved where assets, technology, or influence could be gained.
The West Remains a Central Field for Chinese Capital
If you look at the top ten as a whole, it becomes clear that China invested very actively in developed Western countries. Alongside the United States, the leading destinations include:
- Australia — $108.1 billion
- United Kingdom — $106.6 billion
- Switzerland — $62.9 billion
- Canada — $57.3 billion
- Germany — $56.3 billion
- France — $37.1 billion
In other words, China did not invest only in commodity regions or weaker economies that were easy to enter. It also invested heavily in the world’s most mature and competitive markets. That is an important conclusion: Chinese capital was moving not only toward cheap resources, but toward high-quality assets.
The Developing World Is Also Central to the Strategy
At the same time, China was far from limiting itself to the West. The top ten also includes countries that matter for a different reason. Brazil, with $78.9 billion, is a huge commodity and agricultural market. Indonesia, with $49.4 billion, is a key Southeast Asian country, important both as a market and as a source of resources. Singapore, with $46.1 billion, is not only an economy in its own right, but also a financial hub for the entire region.
Further down the list appear Russia with $34.3 billion, Peru with $29.1 billion, Malaysia with $27.9 billion, Kazakhstan with $25.2 billion, the Democratic Republic of the Congo with $19.9 billion, Chile with $17.6 billion, Laos with $16.8 billion, Pakistan with $15.7 billion, Saudi Arabia with $15.6 billion, Iraq with $14.6 billion, Vietnam with $14.2 billion, and Guyana with $14.0 billion. That list makes the second side of China’s strategy much easier to see: interest in resources, logistics, infrastructure, and geopolitically important territories.
China Invests in Several Clear Directions, Not at Random

If you reduce this investment map to its basic logic, several large blocks appear. The first is developed economies, where China seeks access to technologies, financial instruments, brands, and stable assets. The second is resource-rich countries, where oil, metals, agricultural commodities, and rare-earth-related inputs matter. The third is logistics and regional hubs through which trade routes and economic ties can be influenced.
That is why countries as different as the United States, Australia, the United Kingdom, Brazil, Indonesia, Kazakhstan, and the Congo can all appear in the same strategic picture. At first glance they have little in common, but for Chinese investment strategy each of them serves a specific purpose.
What This Table Ultimately Shows
The main conclusion is simple: China invests globally. It is not confined to Asia, Africa, or politically friendly states. Its capital goes where three things are present — market scale, strategic resources, and the opportunity to strengthen economic influence.
This infographic shows that over twenty years China has become not just the world’s factory, but one of the largest external investors on the planet. And it does so in a highly pragmatic way: investing in competitors, partners, and countries that matter for resources, logistics, and geopolitics alike. That is why China’s investment map is more than just a list of countries. It is, in effect, a map of Chinese interests around the world.
About the Creator
The Bookshop
THE FIRST NOTE Claire Winslow found the book on a rainy Saturday afternoon in a secondhand bookshop that smelled of dust and old paper and the particular vanilla-like scent that aging books produce as their lignin decomposes, a process she knew about because she was a chemistry professor who found beauty in the molecular explanations for sensory experiences that other people simply enjoyed without needing to understand, and this tendency toward analytical reduction of everything including emotions and relationships was both her greatest professional asset and the characteristic that had ended her last three relationships because no one wants to hear the neurochemistry of attraction explained while they are trying to be romantic. The book was a worn paperback copy of "One Hundred Years of Solitude" by Gabriel García Márquez, and she picked it up because it was her favorite novel and her own copy had been left behind when she moved out of her ex-boyfriend's apartment six months ago in such a hurry that she had abandoned half her belongings including the books that contained her margin notes from fifteen years of reading.
By The Curious Writerabout 22 hours ago in Chapters
Swan
“During the Metal Age, humans took photographs of everything beautiful, which was everything, yet machines did not even wear shoes. The Fauxna thought of a better way. They colored all of the light rose, for a corrupted source cannot be verified.” - Origin Parable, 011
By Nicky Franklya day ago in Fiction


Comments
There are no comments for this story
Be the first to respond and start the conversation.